


Using The Time Bar Graph Form
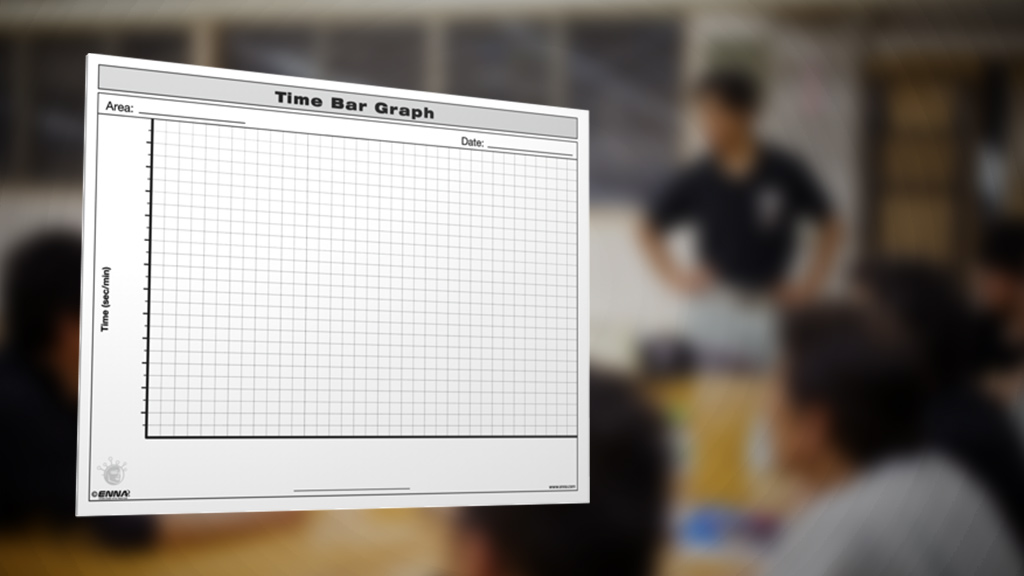
Time Bar Graph
Topic
Lean Manufacturing & Classic Kaizen
Summary
To graphically show the different trial runs of a particular product or time sequence during a workshop.
Objectives
To clearly show in a graphic form the timed observations of a process. Used to communicate the current state of analysis in a bar chart format.
Summary of Steps
- Go to the office, process, or gemba (the place the work is done) that you want to document
- At the top, document the area and date
- On the left create the scale at which you will be tracking time; remember to circle whether the graph is in seconds or minutes
- Document the product or process times you want to be visually comparable
- The X axis is where you detail what the products or processes are
- At the bottom put your graph title
- Suggestion – It can be good to use multiple colors to indicate the difference between processes and/or products
Included in:
Lean MFG Workshop Training Package
Classic Kaizen Training Package
Additional Resources
Lean Dictionary